RAKSHA BANDHAN & INDEPENDENCE DAY FESTIVE OFFER 2025:Academy’s Life-Time Registration ₹1999/- Now Just ₹999/-Only & MONTHLY CLASS FEE ₹1499 NOW JUST ₹999 ONLY FOR 1st 500 STUDENTS.
Chart of Accuracy 2.0/2.4,2.5,2.6
Chart of Accuracy 2.0/2.4,2.5,2.6
Shailendra Singh Sengar(Theory By-Dr. V.P. Tiwari)
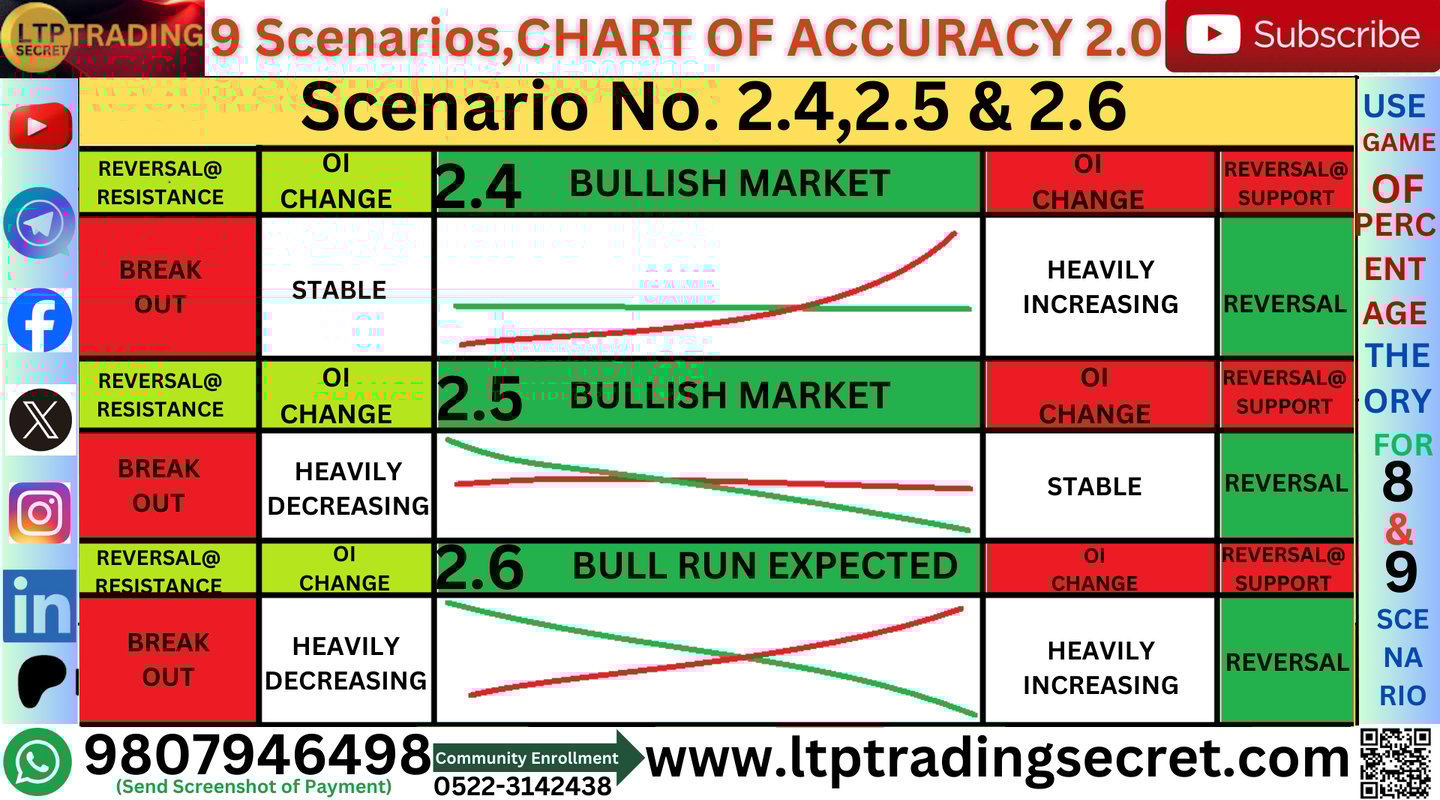
Scenario 2.4
Scenario No.2.4 में जब आप देखेंगे तो call side का open interest stable है मतलब सीधी चल रही है line OI के graph की और, put side का open interest heavily increasing है मतलब put की तरफ से pressure heavily बढ़ रहा है ,ऐसे केस में बाजार मे उस particular strike price के bottom से reversal मिलता है जैसे put side बाटम पर गिरेगा तो आपको call Buy करने का बढ़िया मौका मिलेगा लेकिन जब Top पर जाए(resistance side) तो बिकवाली मत करिएगा क्योंकि market मे break out हो जाता है यानि bullish हो जाता है market क्योंकि put Pressure बना रहा है market को ऊपर भेजने के लिए|
Scenario 2.5
Scenario No.2.5 में जब आप देखेंगे तो call side का open interest heavily decreasing है यानि नीचे की तरफ गिर रहा है और put side का open interest stable है न घट रहा है और न बढ़ रहा है ऐसे केस मे जब बाजार अपने bottom पर पहुंचता है तो reversal दे देता है लेकिन Top पर जब पहुंचे तो बिल्कुल खरीददारी मत करिए क्योंकि call side का open interest heavily decrease हो रहा है ऐसे मे top आपको फंसा देगा market और ऊपर निकल जाएगा यानि जिस स्ट्राइक प्राइस पर यह सपोर्ट करे उस स्ट्राइक प्राइस पर खरीदिए यहाँ मत खरीदिए|
Scenario 2.6
12Scenario No.2.6 में जब आप देखेंगे तो call side का open interest heavily decreasing है यानि नीचे की तरफ गिर रहा है और put side का open interest heavily increasing है ऐसे scenario मे market बड़ा rally देते हुए देखा जाता है यानि bull run expected होता है यदि chart of accuracy 1.0 यदि सपोर्ट करे तो हर बाटम से खरीददारी करते हुए चलिए जबरदस्त रुपये बनाने का मौका मिलेगा |
12When you will see in Scenario No.2.4, the open interest of the call side is stable which means the line is moving straight towards the OI graph, the open interest of the put side is heavily increasing which means the pressure is heavily increasing from the put side, in such a case the market gets a reversal from the bottom of that particular strike price like if the put side falls on the bottom then you will get a good opportunity to buy a call but when it reaches the top (resistance side) then do not sell because the market will break out which means the market becomes bullish because the put side is creating pressure to send the market upwards.
12When you will see in Scenario No.2.5, the open interest on the call side is heavily decreasing, that is, it is falling downwards and the open interest on the put side is stable, neither decreasing nor increasing. In such a case, when the market reaches its bottom, it gives reversal but when it reaches the top, do not buy at all because the open interest on the call side is heavily decreasing. In such a situation, the top will trap you and the market will move up, that is, buy at the strike price at which it supports, do not buy here.
When you will see in Scenario No.2.6, the open interest on the call side is heavily decreasing, i.e., it is falling downwards and the open interest on the put side is heavily increasing. In such a scenario, the market is seen giving a big rally, i.e., a bull run is expected. If the chart of accuracy 1.0 supports, then keep buying from every bottom, you will get a huge opportunity to make huge money.