RAKSHA BANDHAN & INDEPENDENCE DAY FESTIVE OFFER 2025:Academy’s Life-Time Registration ₹1999/- Now Just ₹999/-Only & MONTHLY CLASS FEE ₹1499 NOW JUST ₹999 ONLY FOR 1st 500 STUDENTS.
Chart of Accuracy2.0/2.1,2.2,2.3
chart of accuracy 2.0/2.1,2.2,2.3
Shailendra Singh Sengar (Theory By- Dr. Vinay Prakash Tiwari)
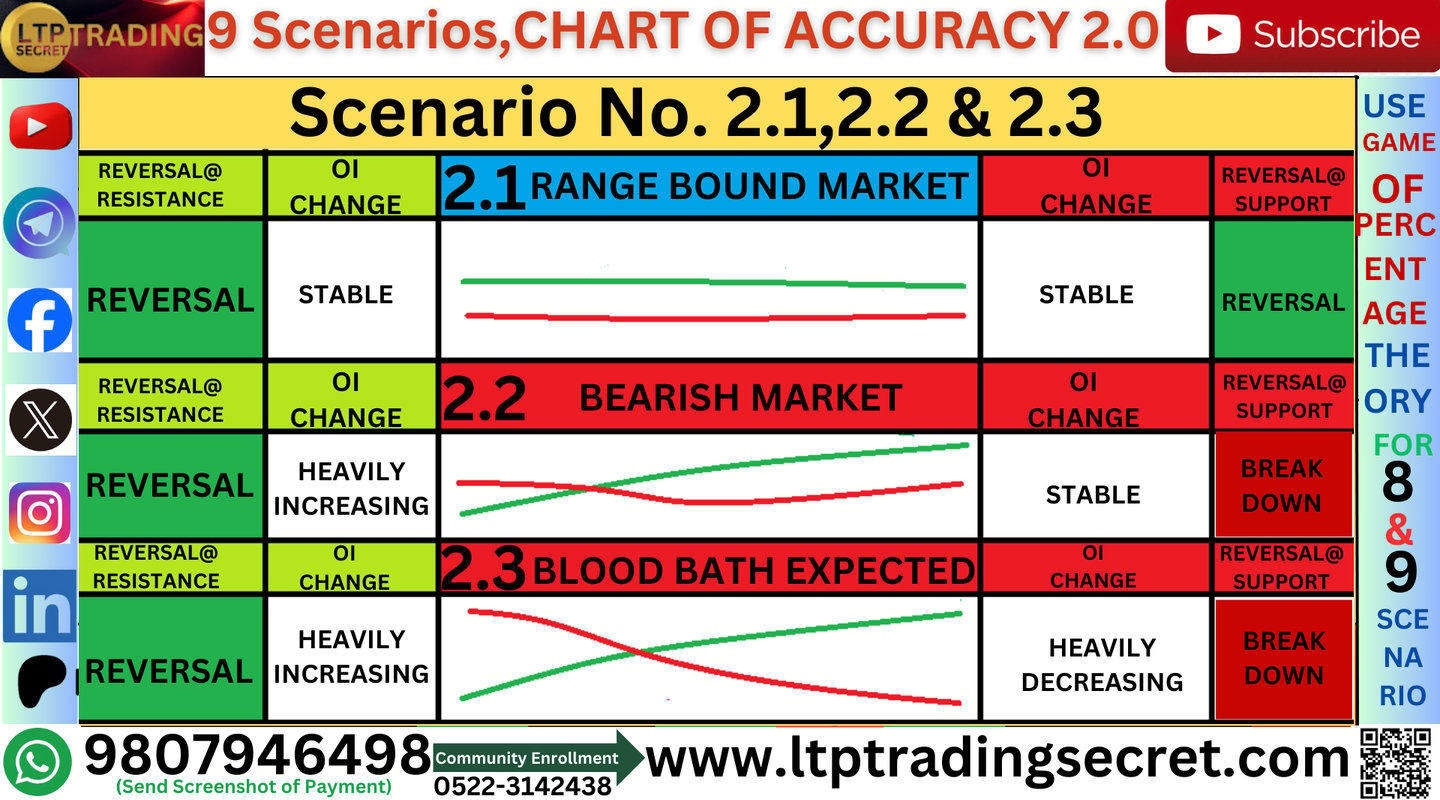
SCENARIO NO. 2.1 :-
12Scenario number 2.1 मे STABILITY का मतलब CALL side का open interest straight forward चल रहा है,call side का open interest न ड्रॉप हो रहा है न रेज हो रहा है और put side का भी open interest ना ड्रॉप हो रहा है ना रेज हो रहा है जो अक्सर आप स्ट्राइक prices पर देखते रहते हैं,इस stability के केस मे क्या होता है ? जब आप उस स्ट्राइक प्राइस के इर्द-गिर्द क्लिक करेंगे तो जो VALUES आएगी तो diversion और end of diversion (EOD) मतलब टॉप वाली values से आप बिकवाली भी कर सकते हैं और bottom वाली value से खरीददारी भी कर सकते हैं बशर्ते की ये उस particular strike price पर हो जिसके इर्द-गिर्द मार्केट चल रहा है ना की उसके ऊपर वाली या नीचे वाली strike price पर | जैसे अभी मान लिया 22750 के इर्द-गिर्द मार्केट चल रहा है तो अगर 22750 पर दोनों PARALLEL चल रही है तो ऐसे केस में REVERSAL हमको दोनों तरफ से मिलेगा |
SCENARIO NO. 2.2 :-
12SCENARIO NUMBER 2.2 में जब call side का open interest heavily increasing हो रहा हो इसका मतलब call side की लाइन ऊपर की direction की तरफ जा रही हो या चल रही हो और put side का open interest stable हो यानि यह बिना ऊपर नीचे move किए stable चल रही हो तो ऐसा scenario बहुत मजेदार होता है और ऐसे scenario मे call side में जब market यानि suppose करिए जब 22750 के इर्द-गिर्द बाजार (MARKET) चल रहा है और 22750 पर call side का open interest बढ़ रहा है और put side का open interest stable है तो ऐसे केस मे क्या होगा ! Market कहाँ जाएगा? Market अपने diversion पर जाएगा(टकराएगा) और वापिस चला आएगा यानि DOT to DOT diversion आएगा और वहीं से reverse हो जाएगा तो हम उस diversion का benefit उठा सकते हैं,उस diversion का trade ले सकते हैं ,कहते हैं ना हम लोग diversion का trade कभी समझ मे आता है कभी नहीं आता है लेकिन उसी strike price का अगर bottom आए तो खरीददारी मत करिए भले ही Chart of Accuracy COA 1.0 बोलता हो की खरीददारी कर लीजिए तो भी फिर भी मत करिए!क्यों ? क्योंकि क्या होगा की market उस bottom से भी फिसल जाएगा,फिर अगली bottom का wait करिए उस bottom पर मत करिए जिस bottom पर Chart of Accuracy 2.0 भी सपोर्ट करे,तो Risky Traders या यहाँ पर वही मैटर या जाता है की Risky Traders का रिस्क और बढ़ रहा है या घट रहा है तो Chart of Accuracy 2.0 रिस्की Traders के Risk को बता देती है की आपका Risk कैसा है,बढ़ता हुआ Risk है की घटता हुआ Risk है और आपके Trade को और Accurate कर देता है|
SCENARIO NO. 2.3 :-
12Scenario Number 2.3 में क्या होता है?इस Scenario मे Call Side का Open Interest Heavily Increasing है मतलब Continuously ऊपर की तरफ बढ़ रहा है और Put Side का Open Interest Heavily Decreasing है यानि Continuously नीचे की तरफ गिर रहा है ऐसे Scenario भी आपको कई बार देखने को मिलेंगे,बड़े मजेदार Scenario होते हैं ये same Scenario ऐसा ही है जैसे Scenario COA 2.2 वाला है वैसे ही यह भी Scenario(COA 2.3) भी है लेकिन इसमे Put Side की OI भी Heavily Decreasing है तो Put Side भी ज्यादा दिक्कत देता है मतलब Scenario COA 2.2 Bearish लिखा है ध्यान से देखेंगे तो जबकि इस Scenario मे Blood Bath Expected लिखा हुआ है यानि ऐसे Scenario मे Market मे बढ़िया Fall यानि गिरावट देखा जाता है,Put Side गिरते ही Market टूट जाता है,गिर जाता है अक्सर आप live market मे आप मेरे साथ देखते हैं जब हम लोग Trade कर रहे होते हैं तो suddenly आप देखते होंगे एक बड़ा सा Red Candle बनता है और Market तास के पत्ते जैसे धड़ाम से गिर जाता है Drop हो जाता है क्योंकि Put Side के सारे Open Interest Suddenly Drop हुए थे एकदम सीधा -सीधा Drop हुए थे नीचे की तरफ तो ऐसे मे बड़े Falls या जाते हैं और उसका benefit हम लोग उठा सकते हैं TOP से बिकवाली करके Chart ऑफ Accuracy COA 1.0 को ध्यान मे रखते हुए जब दोनों आपस मे मैच होंगे तो जबरदस्त वाले बेहतरीन वाले Trade आपको देखने को मिलेंगे |
12In scenario number 2.1, STABILITY means that the open interest on the CALL side is moving straight forward, the open interest on the call side is neither dropping nor rising, and the open interest on the put side is also neither dropping nor rising, which you often see at the strike prices. What happens in case of this stability? When you click around that strike price, the values that will appear will be diversion and end of diversion (EOD) means you can sell from the top values and can also buy from the bottom value, provided it is at that particular strike price around which the market is moving and not at the strike price above or below it. For example, suppose the market is moving around 22750, then if both the prices are moving parallel to 22750, then in such a case we will get REVERSAL from both the sides.
12In SCENARIO NUMBER 2.2 when the open interest of the call side is heavily increasing it means the line of the call side is going in the upward direction and the open interest of the put side is stable i.e. it is moving stable without moving up and down, then such a scenario is very interesting and in such a scenario when the market on the call side, i.e. suppose the market is running around 22750 and the open interest of the call side is increasing at 22750 and the open interest of the put side is stable, then what will happen in such a case! Where will the market go? The market will go to its diversion (clash) and come back i.e. DOT to DOT diversion will come and it will reverse from there, then we can take advantage of that diversion, we can take trade on that diversion, we say that sometimes we understand diversion trade and sometimes we don’t, but if the bottom of the same strike price comes, then do not buy, even if Chart of Accuracy COA 1.0 says to buy, even then do not buy! Why? Because what will happen is that the market will slip from that bottom also, then wait for the next bottom, do not trade at that bottom which is supported by Chart of Accuracy 2.0 also, so for Risky Traders, the matter here is same that the risk of Risky Traders is increasing or decreasing, so Chart of Accuracy 2.0 tells the risk of Risky Traders that what is your risk, is it increasing risk or decreasing risk and makes your trade more accurate.
12What happens in Scenario Number 2.3? In this scenario, the Open Interest of the Call Side is Heavily Increasing, meaning it is continuously moving upwards and the Open Interest of the Put Side is Heavily Decreasing, meaning it is continuously falling downwards. You will get to see such scenarios many times, they are very interesting scenarios, this is the same scenario, just like Scenario COA 2.2, this scenario (COA 2.3) is also similar, but in this the OI of the Put Side is also Heavily Decreasing, so the Put Side also gives more problems, meaning Scenario COA 2.2 is written Bearish if you look carefully, whereas in this scenario it is written Blood Bath Expected, meaning in such a scenario a great fall is seen in the market, as soon as the Put Side falls, the market breaks, falls, you often see with me in the live market, when we are trading, then suddenly you must have seen a big red candle is formed and the market It drops just like a pack of cards, because all the Open Interest on the Put Side had suddenly dropped, had dropped straight downwards, so in such a case big falls are expected and we can take advantage of it by selling from the TOP, keeping in mind the Chart of Accuracy COA 1.0, when both will match with each other then you will get to witness amazing and excellent trades.